Showing posts with label single factor analysis. Show all posts

Tuesday, March 17, 2020

Death from Despair Part 5: Analysis by Race, by Race Crossed with Gender, by Race, Gender and Age (Analysis of American Indian/Alaskan Native and White Males by Age)

1. Analysis by Race

American Indians/Alaskan Natives consistently have the highest rate of death. That is followed closely by Whites. That the Total line closely follows the White line is unsurprising given that Whites form the largest racial group.  African Americans and Asians fall below the Total line. As we have seen earlier the line for African Americans has risen sharply in the last few years because of sharp increase in drug-related deaths. Asians may have the lowest death rate however, the death rate for Asians continues to rise, not at the accelerated rates of the three groups, but are rising nevertheless. 


Of concern, deaths from despair continue to rise for everyone no matter your racial group.


2. By Race and Gender

I further subdivided the data by gender. In the figure below, females are represented by squares and males by circles. 

Every group has shown an increase in deaths from despair, even female Asians who clearly show the lowest rate of increase. As a whole, females show a lower death rate than males. One notable exception is that male Asians have a lower death rate than American Indian/Alaskan Natives and female Whites.

What I find particularly striking about this graph are the lines for American Indian/Alaskan Native Males and White Males. Both lines follow a steeper trajectory with strikingly higher death rates than the other groups. What I find striking as well is that these two lines closely follow each other. And for those two reasons I decided to drill into the data from these two groups with Age as a factor.

3. Analysis of American Indian/Alaskan Native Males and White Males


I added age as an analysis factor for these two groups. The figure below shows the results of that analysis.

American Indian/Alaskan Native male lines have downward pointing triangles. White males have circles. 

Something to note: American Indians/Alaskan Natives have jagged lines. The reason is that the underlying numbers are relatively small so a relatively small change can seem to show large swings in the crude rate. That being the case one needs to focus not on the swings but on the overall trends that unfortunately point strongly upward.

I selected most productive years in 10 year age ranges that consist of the 10 year age ranges of:
  • 25-34
  • 35-44
  • 45-54
  • 55-64
For both American Indian/Alaskan Native males and White males the most deadly years range from 45 to 64. For American Indian/Alaska Natives males those years have proven particularly deadly, especially in recent years. And it is clear, that for American Indians/Alaskan Native males, deaths from despair begin relatively early in life and become more strongly pronounced as they grow older.

Something that interested me was the American Indian/Alaskan Native and Whites show similar patterns in the 25 to 34 age range. 

Two more figures separately show American Indians/Alaskan Native and White males.


These two groups are clearly at the most risk for death from despair and the numbers are staggeringly high.

This series of articles will continue. 


Monday, March 2, 2020

Death from Despair Part 4: Analysis by Age Groups


This data was collected from CDC's Wonder database for all the years available: 1999 to 2018. They're broken down into 10 year age groups from 15 to 85 (plus) years old. I removed from the figures the age groups for everyone under 15 years old and all those where the age the person was not reported. The under 15 years old age group data showed crude rates of less than 1 death per 100,000, too low to be included in the figures.

Deaths from Despair by Age Group

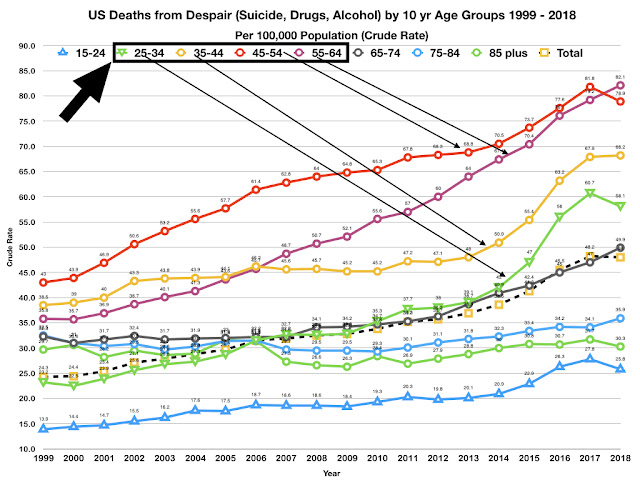
The figure below shows the crude rates of death from despair by age group. The dashed line curve is the overall total for all age groups to provide a baseline of comparison and a dividing line for those over, under and on the line. 

As seen in other studies two age groups, 45-54 and 55-64, show the highest growth rate  as well as the highest number of deaths from despair. Those in the 65-74 age group closely follow the Total line.   


I inserted the figure above to call attention to something that I found particularly disturbing. The age groups I have boxed are those ages that could only be considered "the prime of life." One would consider these to be the best years of anyone's life. (I know I do.) Yet in recent years, the rate of death from despair are 1) above the Total baseline and 2) the highest of all the age groups. Furthermore, the growth rates for the 25-34 and 35-44 age groups has noticeably jumped over the last 5 years.

The two age groups with little or no growth are the 75-84 and 85+ groups. Furthermore, they're below the baseline. 

The 15-24 age group has the lowest crude rate, but it's a crude rate has nearly doubled during this 20 year period and that is concerning.

Finally, to point out that during 1999, the data points for most of the age groups were in a much closer range (from 13.9 to 43.0) than in later years where the spread has become much wider from a crude rate of 25.8 to 82.1. 

Monday, February 24, 2020

Deaths from Despair Part 3: Across US Metropolitan Areas

When I was analyzing suicide data, I subdivided the data by a variety of factors, both by single factors and multiple factors. One of those factors that proved itself as something of interest was the metropolitan area where the suicide victim resided. What I found was that the smaller the metropolitan area, the higher the suicide rate relative to the other metropolitan areas in each year. This was particularly true in more recent years. Since, death by suicide is one of measurements included in death from despair it makes sense to examine this data using as a factor in the analysis, metropolitan area. 

The figure below shows the death rate from despair for the six 2013 US metropolitan areas. The death rate for all metropolitan areas is shown as a dashed line.

Several things jump out from the figure above:
  • The rate of death from despair from 1999 to 2018 has doubled and no metropolitan area has been spared.
  • Death rates dropped from 2017 to 2018 except for large metropolitan and noncore areas.
  • In 1999 large central metropolitan areas had the highest rate of death from despair. However, by 2018, they had the lowest rate. 
  • In 1999 large fringe metropolitan areas had the lowest rate of deaths from despair while the other metropolitan areas were more tightly bunched.
  • Over time, two clusters have developed: 1) large metropolitan areas and 2) medium-small metropolitan areas. Large metropolitan areas fall under the overall rate while the medium-small metropolitan areas are over the overall rate.
The figure below shows the year to year trends for large and medium-small metropolitan areas. And the figure that follows shows the year to year differences between the rates of death from despair for medium-small and the large metropolitan areas. 


These two figures show that while death rates from despair have increased dramatically in both clusters, the gap between large and medium-small metropolitan areas has grown over time with more deaths from despair occurring more frequently in medium-small metropolitan areas than in large metropolitan areas.

One of the reasons for the difference in rates of death may in part be due to the fact that economic opportunities have continued to shift to large metropolitan areas and economic opportunities continue to diminish in medium-small areas. That may help explain the difference we're seeing between large and medium-small areas. However, deaths from despair continue to increase in all metropolitan areas at an alarming rate. If economic opportunity were the explanation, then one would expect large metropolitan areas to be showing a dramatically lower rate of increase or no increase at all or maybe even a decrease in the rate of death from despair, but that's not what we're seeing. 

Deaths from despair have been increasing, but they have been increasing at a faster pace in medium-small than in large metropolitan areas in the US. 

Wednesday, February 19, 2020

Deaths from Despair Part 2: Gender as a Factor

Before I get into the data, I want to mention that the 2018 data has been loaded on the CDC's Wonder database (https://wonder.cdc.gov). I'll update some of recent findings using this new data. The new data has changed my projections for 2025. They're less dire than my earlier projections, nevertheless, they're still unacceptable. I'll discuss the updated projections at the end of this article.

My approach in this series of articles is to first consider single factor comparisons before I drill down into multi-factor comparisons and trend analysis. In this article I focus on gender. In later articles I'll focus on age, race, Hispanic, size of the community, etc. I'll also divide the data into two groups: 1) drug and alcohol deaths and 2) suicides, and analyze the data by the same list of single factors used to analyze deaths from despair. After the single factor analysis, I'll focus on multi-factor comparisons. 


Deaths from Despair: Gender Comparisons

From my analysis of suicide and drug-overdose deaths data, I found that there were clear differences between men and women. You'll note that there are clear gender differences when it comes to deaths from despair as you'll note in the figures below.


In terms of the number of deaths per 100,00 (crude rate), men die in much greater numbers than women. The difference is stark. Furthermore, the trend lines are decidedly different. In both cases, the trend is upwards, but with women the curve is linear, meaning the rate remains the same from year to year. However, the trend line for men is curvilinear, meaning that the rate of increase is accelerating.

One positive things to note is that in 2018 for both men and women, the number of deaths dropped from 2017. However, as I noted before, the number of drug overdose deaths for 2017 jumped dramatically from 2016, well beyond my worst case expectations. The hope is that the 2018 results suggest a downward trend, but it may be that the 2018 suggest only a slowing of the rate of increase, not a change in direction. A signal of a change in direction would be that the number of deaths in 2018 was less than 2016 and that's not the case.

Updates to Trend Lines

I want to mention that I have updated the trend line for Total (men and women combined) as a result of the addition of the 2018 data point. Although a 3rd order curve is a slightly better fit, the 2nd order curve better accounts for the addition of the 2018 data. And as you'll note has a lower acceleration rate.


Number of Deaths

The figure below shows the actual number of deaths for women, men and total number. 

The figure above puts the problem the US faces in stark terms. Yes, there was a drop in the total number of deaths from despair from 2017 to 2018, but any way you look at it nearly 157,000 (total) deaths from despair each year is unacceptable as well as all of the unnecessary deaths from despair during this 20 year period from 1999 to 2018. 

What's Going on in America? Why is this happening?

I've started reading the book by Kristof and WuDunn, Tightrope (2020)There are a couple of quotes from their book that I believe are applicable here:

  • "Gallup found that Americans are among the most stressed populations in the world, tied with Iranians and even more stressed than Venezuelans." 
  • "America now lags behind its peer countries in health care and high-school graduation rates while suffering greater violence, poverty and addiction."
The numbers and the trends provide further support to these quotes. And I believe help explain why these numbers are so high. 

I'll discuss more of the possible reasons why Americans die with such frequency from despair in later articles. 

Gender Differences

Women may be dying less from despair than men -- about 1/3 as many per year. But approximately 45,000 deaths per year in 2017 and 2018 is a number that should be of great concern. And then one examines the number of men dying from despair. Yes, women do seem to be more resilient, but there are levels of stress can overcome even the most resilient.

The nearly 112,000 men dying in the last two years should be significant concern. In contrast approximately 115,000 Americans died each year as a result of conflict in World War II, the bloodiest war in world history. For America the time for that war was just over three and a half years. And here we're seeing over 20 years each year deaths in the range of what you would expect in a full scale war. And these are avoidable deaths. 

Projections to 2025

The following two figures show my current projections from 2019 to 2025. 


These projections are based on my current trend lines as shown in the first figure. 

I have the greatest confidence in the projected trend line for women. Based on everything that we have seen, deaths from despair for women will continue to increase the steady pace shown in the figures. I have less confidence in the trend for men. Accelerated growth is difficult to project into the future.

The trend line to 2025 combining men and women (total) that includes the 2018 data shows about 100,000 fewer deaths projected for 2025 than my earlier projection. That earlier figure is shown below.


217,000 deaths instead of 331,000 is over one third fewer, but 217,000 deaths is still a staggering number of deaths from despair. But even if the number of per year deaths remained the same from year to year from 2018, 157,000 total deaths each year is a staggering number of avoidable deaths, in this case, from despair.