This data was collected from CDC's Wonder database for all the years available: 1999 to 2018. They're broken down into 10 year age groups from 15 to 85 (plus) years old. I removed from the figures the age groups for everyone under 15 years old and all those where the age the person was not reported. The under 15 years old age group data showed crude rates of less than 1 death per 100,000, too low to be included in the figures.
Deaths from Despair by Age Group
The figure below shows the crude rates of death from despair by age group. The dashed line curve is the overall total for all age groups to provide a baseline of comparison and a dividing line for those over, under and on the line.

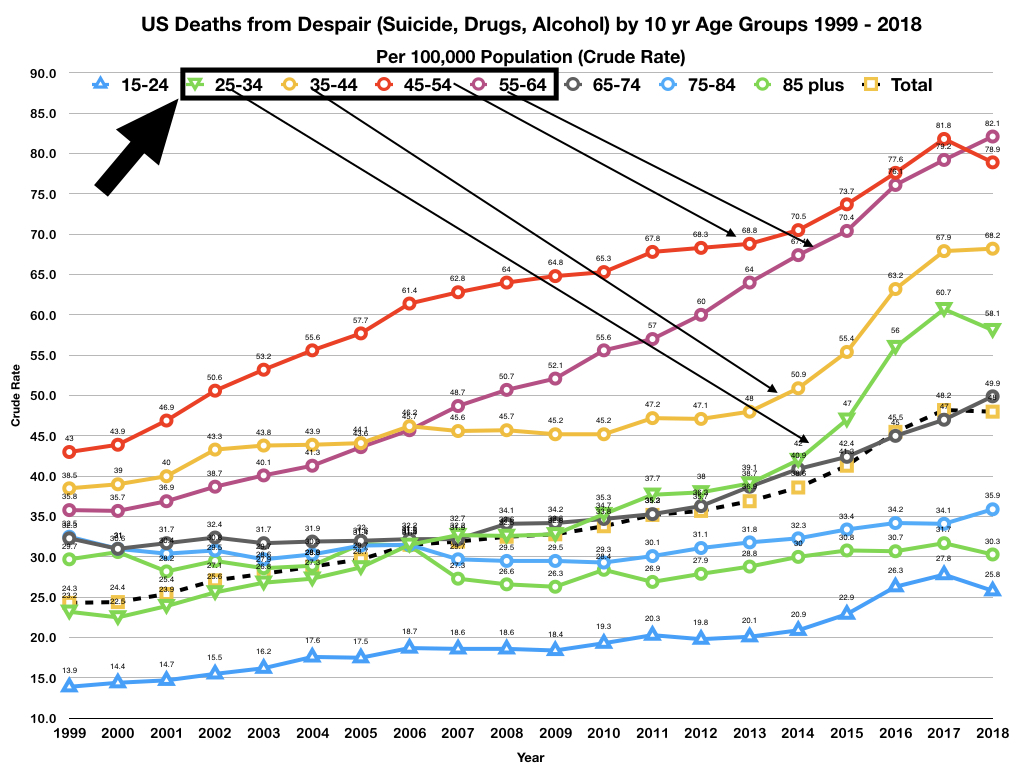
The two age groups with little or no growth are the 75-84 and 85+ groups. Furthermore, they're below the baseline.
The 15-24 age group has the lowest crude rate, but it's a crude rate has nearly doubled during this 20 year period and that is concerning.
Finally, to point out that during 1999, the data points for most of the age groups were in a much closer range (from 13.9 to 43.0) than in later years where the spread has become much wider from a crude rate of 25.8 to 82.1.
No comments:
Post a Comment